
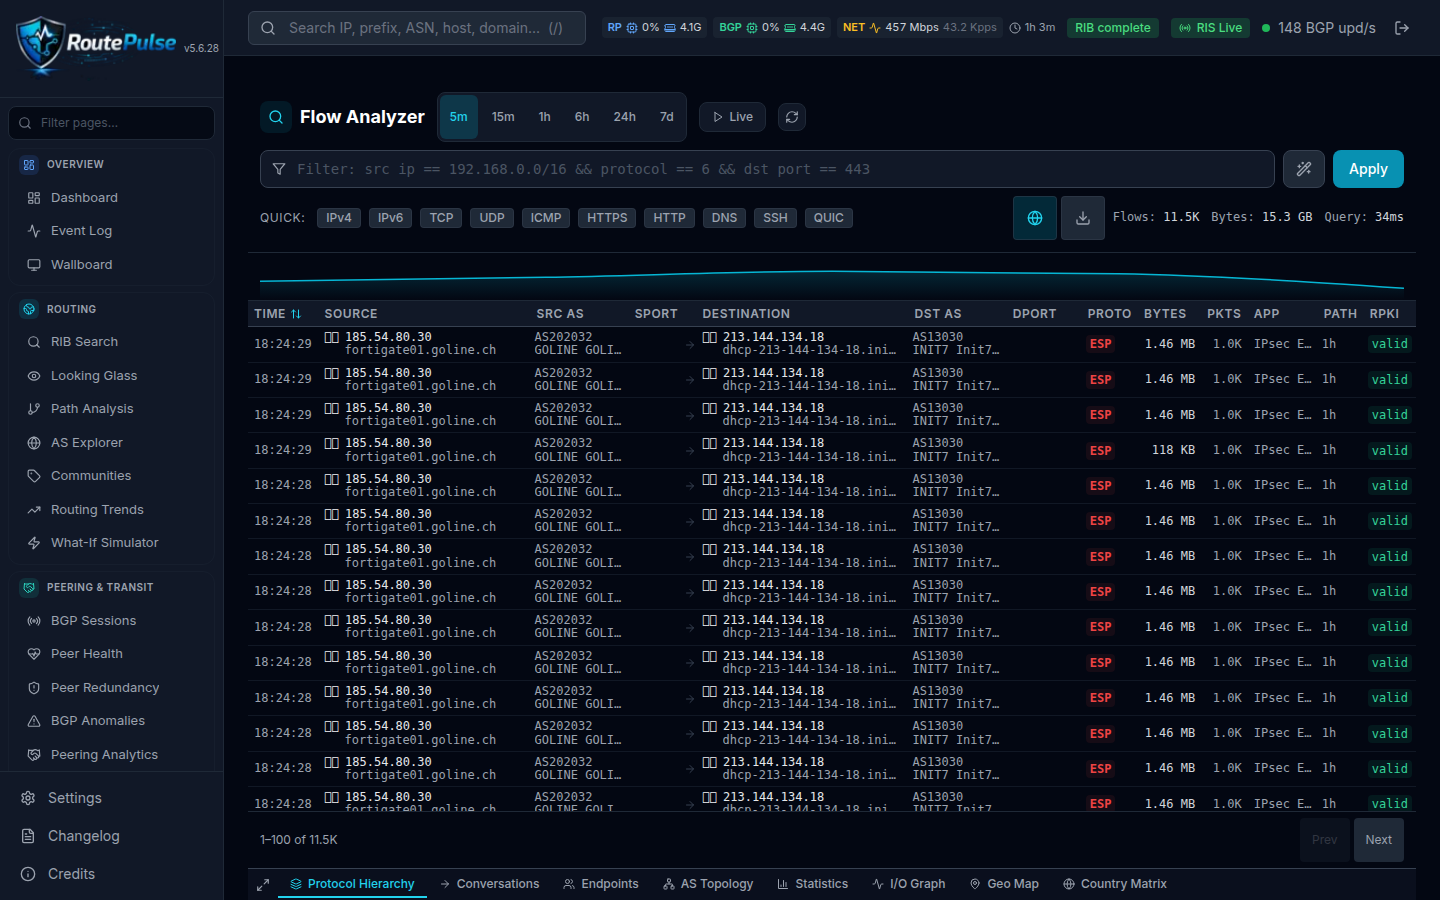
Real-Time Flow Analyzer — Wireshark-grade investigation in the browser
The Flow Analyzer is RoutePulse’s ad-hoc investigation tool — Wireshark ergonomics applied to network-wide flow telemetry, not a packet capture on one wire. A 3-zone layout (Command Bar · Flow Table · 8 Analysis Tabs) lets an operator move from “I see something weird on the WAN” to “here is the AS-path, the RPKI status, the AbuseIPDB score and the great-circle arc on a world map” in three clicks. Socket.io live mode streams 50 flows every 2 s from an in-memory buffer, bypassing ClickHouse entirely for zero-latency observation; historic queries hit the same 44-table ClickHouse store powering the rest of the platform.
v4.32.80-82 delivered a cold-load performance breakthrough — 5 min → <500 ms via parallelization of 7 previously-sequential ClickHouse queries (Promise.all instead of await chain), 4 new compound indexes on flows.timestamp + src_asn + dst_asn, and elimination of one correlated subquery that was scaling N×events. The same audit ([feedback_perf_regression_5_slice_audit] in operator memory) caught a deliberate-serialize regression in 1250278 v4.32.18 that had been hiding behind warm-cache numbers for two months. Now: first paint <500 ms, P95 query latency stays under Apache’s 20 s ProxyTimeout ceiling, and the Live mode keeps a steady 50 flows/2 s heartbeat regardless of historical-query load.
v4.32.80-82 cold-load perf — 5 min → <500 ms
Three-wave fix shipped as three observable commits: (1) parallelize — seven sequential await calls collapsed into one Promise.all; (2) indexes — four compound ClickHouse indexes on (timestamp, src_asn, dst_asn), (timestamp, dst_port), (timestamp, dpi_app), (timestamp, country); (3) kill correlated subquery — replaced N×events scan with one JOIN over a 50-row pre-aggregated CTE. Verified with EXPLAIN ANALYZE proof at each step (613 ms → 42 ms on the heaviest query). Apache’s 20 s ProxyTimeout no longer fires on first paint.
Wireshark-style filter syntax + 8 Analysis Tabs
Filter expressions follow Wireshark conventions (ip.src == 1.2.3.4 && tcp.dstport == 443 && !dns) with a Filter Builder Wizard for 18 fields across 8 categories and 8 preset templates. Quick-filter chips for TCP / UDP / ICMP / HTTPS / HTTP / DNS / SSH / QUIC are one-click. The 8 Analysis Tabs — Protocol Hierarchy (Wireshark tree), Conversations (top 50 bidirectional pairs), Endpoints (top sources + destinations side-by-side), AS Topology (top 30 AS-to-AS links), Statistics (P50/P90/P95/P99 latency & bytes percentiles), I/O Graph (adaptive timeline), Geo Map (great-circle arcs on react-simple-maps), Country Matrix (D3 chord diagram) — all share the same active filter, so refining a query in one tab updates every other tab instantly.
Live Socket.io streaming · 3-tier ASN enrichment · inline threat badges
Live mode opens a Socket.io channel and delivers a reservoir-sampled stream of 50 flows every 2 s straight from the collector’s in-memory buffer — ClickHouse is never touched, so a 30 s burst will not slow the live view. Each row carries country flags (flagcdn.com PNG 16×12 retina), inline AbuseIPDB threat badges (orange 50–79%, red ≥80%), RPKI validation status, and AS-PATH hop count. Clicking any flow opens a 380 px detail panel with GeoIP, 6 metric cards, full AS-PATH chain, RPKI verdict, reverse DNS and threat-intel cross-reference.
Key Capabilities
- 3-zone Wireshark-inspired layout — Command Bar (filter + presets), Flow Table (14 columns), 8 Analysis Tabs sharing one active filter
- v4.32.80-82 cold-load perf — 5 min → <500 ms via
Promise.allparallelization + 4 ClickHouse compound indexes + correlated-subquery elimination - Live mode via Socket.io — 50 flows every 2 s from in-memory buffer, ClickHouse-bypass, reservoir-sampled for uniform representation
- Wireshark-style filter syntax (
ip.src,tcp.dstport,!dns, etc.) + Filter Builder Wizard with 18 fields / 8 categories / 8 preset templates - Quick-filter chips — TCP, UDP, ICMP, HTTPS, HTTP, DNS, SSH, QUIC — one-click protocol drill
- 8 Analysis Tabs — Protocol Hierarchy, Conversations, Endpoints, AS Topology, Statistics (P50-P99), I/O Graph, Geo Map (great-circle arcs), Country Matrix (D3 chord)
- 14-column flow table — Time, Src IP+flag, Src AS, Src Port, direction arrow, Dst IP+flag, Dst AS, Dst Port+service, Protocol, Bytes, Packets, Application, AS-PATH hops, RPKI badge
- Inline threat intel — AbuseIPDB score badges (orange 50-79%, red ≥80%) on every row; RPKI invalid/valid/unknown visualised
- 380 px click-to-expand detail panel — GeoIP, 6 metric cards, RPKI verdict, full AS-PATH chain, reverse DNS, threat-intel cross-reference
- 3-tier ASN enrichment — 50 K LRU cache → direct RIB Patricia trie (500 ms timeout) → WhoisService — 98.8% IPv4 / 99.7% IPv6 attribution
- CSV / JSON export, URL-serialized bookmarkable queries, toggleable reverse DNS, dense vs comfortable row density
- Apache ProxyTimeout 20 s respected on every endpoint after the v4.32.80-82 audit — no more 502 HTML “<” responses in React Query
Engineered and operated by the GOLINE SOC & Network Engineering team.
Explore all RoutePulse features →